Roberto Ambrosini & Niccolò Fattorini (roberto.ambrosini@unimi.it)
Department of Environmental Science and Policy, University of Milan
Via Celoria 26, 20133 Milano (Italy)
Migratory connectivity is defined as the linkage among individuals between the periods and areas where they spend different phases of their annual life cycle. The strength of migratory connectivity thus represents the extent to which individuals mixed in different seasons. Within the framework of the CMS/EURING Eurasian-African Bird Migration Atlas, we investigated the patterns and strength of migratory connectivity in 137 bird species through the analysis of ring recoveries. We included in the analyses all species breeding within the Palearctic-African migration system, thus extending the analyses also to resident species and populations.
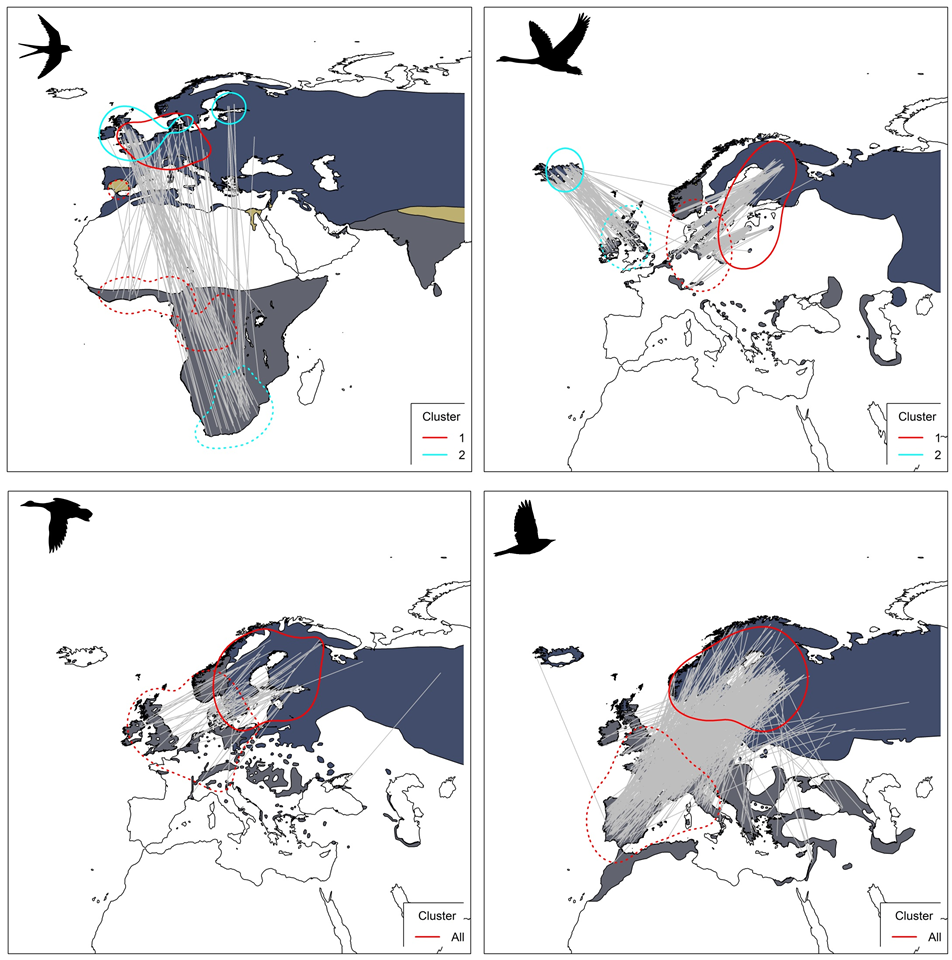
For each species, we applied a robust data selection to assure the highest possible quality of the data. Using the geographical positions of individuals during breeding and non-breeding stationary periods, we estimated the strength of the migratory connectivity as the correlation between the distances among individuals in the breeding and the wintering grounds. If this analysis showed connectivity, we further checked whether it was due to the presence of clusters of individuals that stay together during the breeding and the non-breeding period (independently of the reciprocal position of individuals within each cluster) or individuals show “pattern transference”, i.e. they tend to maintain the same reciprocal positions.
To check for the robustness of the results when the sample size was small, we rarefied our samples and showed that the power of these analyses is reasonable for a sample size of at least 30 individuals. Ringing data are also affected by large spatial heterogeneity in sampling effort, which is particularly strong when live recaptures are considered, while dead recoveries are generally considered less affected. To check whether the inclusion of both live recaptures and dear recoveries may have affected our results, we re-ran the analyses separately for individuals whose second (most recent) encounter was either a dead recovery or a live recapture. Also in this case, the results on either dataset were generally consistent, thus confirming the robustness of the results.
We then applied a second method of analysis to estimate migratory connectivity that needs to establish a priori breeding and non-breeding regions. We arbitrarily defined 15 regions encompassing the European and African continents (Europe: 8 regions, Africa: 7 regions) and assigned each encounter to the corresponding region. We then compared the measures obtained from the two methods and found that they showed good agreement and replicability.
Overall, the migratory connectivity of birds in the European-African migration system showed high interspecific variability, but almost all (c. 92%) of the species analysed exhibited significant connectivity. Amongst them, migratory connectivity was mainly due to clustering (c. 77% species), whereas few species showed connectivity from pattern transference, suggesting that migration strategies also vary at the intraspecific level, with most species showing geographically distinct migratory populations.
We further summarized the results using a phylogenetic comparative meta-analysis, that allowed comparing the strength of migratory connectivity among different groups of species by also accounting for the phylogenetic relationships among them. For this analysis, based on the results of the simulations exposed above, we retained only the species having at least 30 individuals and discarded the introduced Aix galericulata and Branta canadensis. The final dataset for this analysis was therefore 129 species. We compared the strength of migratory connectivity between resident, partial or full migrant species and between passerines and non-passerines while also accounting for the body mass of the species. Indeed, in birds, body mass accounts for a wide set of biological features of a species, such as longevity, ability to fly long distances etc. and is therefore often included in the meta-analyses as a proxy of all these features also because data on body mass are easily available.
The results showed that migratory connectivity was generally positive and strong, suggesting that individuals of the analysed species tend, on average, to maintain their reciprocal positions when relocating between breeding and non-breeding grounds or during breeding and non-breeding periods. Residents also showed the highest levels of migratory connectivity, partial migrants intermediate levels, and full migrants the lowest values. Moreover, larger species tended to show higher degrees of migratory connectivity, while no significant difference appeared between passerine and non-passerine species. Previous studies have shown that migratory connectivity decreases with migration distance. Most likely, our full migrant species were those experiencing longer migration distances, which may explain their weaker connectivity. Additionally, larger species are those that live longer. A longer lifespan promotes the social transmission of migratory routes towards the non-breeding sites and helps maintain migratory knowledge across generations which may have promoted a higher population mixing in smaller species.
We also found the absence of a phylogenetic signal in the strength of migratory connectivity. Thus, phylogenetic relatedness between species did not seem to play a role in shaping migratory connectivity. Rather, our comparative analysis suggested that geographical predictors or social life-history traits are more likely to affect how birds redistribute between the breeding and non-breeding periods and grounds.
Earlier research called for gaining knowledge on how birds mix between breeding and non-breeding grounds to assist the conservation of European migrants. The analyses run for the CMS/EURING Migration Atlas were able to identify species-specific patterns of migratory connectivity accurately for a large set of species, thus providing a critical tool that can be used to inform conservation and management strategies on target species on a case-by-case basis. Our results also show that the concept of migratory connectivity can be easily extended also to a temporal dimension, i.e. to analysing how individuals re-distribute during different stages of their annual life-cycle, thus allowing to include in the analyses also species or populations with mixed migration strategies and also resident species. In quantifying and describing the strength and patterns of migratory connectivity across European bird species, we hope that our analysis will improve our understanding of avian migration and, from a more practical point of view, will facilitate bird conservation and management at the population level.
Publication
Fattorini, N., Costanzo, A., Romano, A., Rubolini, D., Baillie, S.R., Bairlein, F., Spina, F. and Ambrosini, R. Eco-evolutionary drivers of avian migratory connectivity. Ecology Letters https://doi.org/10.1111/ele.14223
| Élément joint | Taille |
|---|---|
| Migratory Connectivity - Full Report (4.67 Mo) | 4.67 Mo |
| Graph showing Mantel correlation coefficient (174.22 Ko) | 174.22 Ko |