Jump to -
- Visualisations
- Statistics
- Sensitive species
- Species list & taxonomic splits
- Geographic regions of Europe
- Biases & interpretation
- Data validation and filtering
- Optimisation for mapping
Quick guide
Click for a quick navigation guide of the Migration Atlas' visualisations and associated text. Read on for more detailed information about the visualisations and how the data were handled.

Visualisations
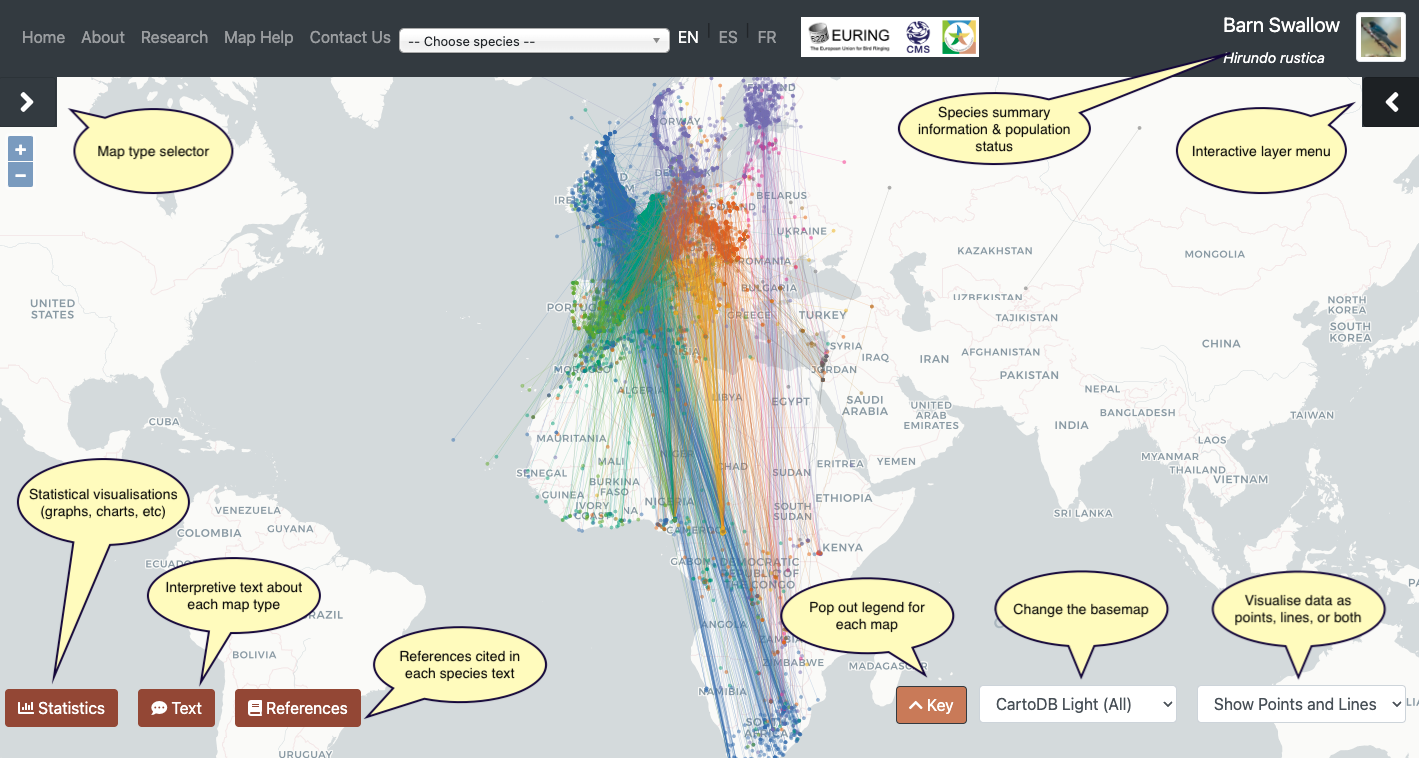
Species accounts include four main interactive map visualisations with associated interpretive text (click the 'Text' button) and cited references, general information about the species, its populations and migratory behaviour (click the species name), and statistical visualisations of the ringing data (graphs, charts, etc).
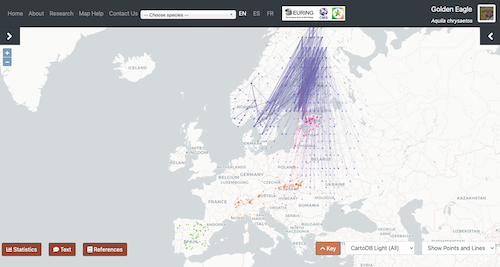
Overall connectivity
This is the landing map for all species, and shows overall patterns of migratory connectivity, highlighting differences by geographic region, age, and sex. Click the 'Text' button to view interpretive information about the maps
By region
In the ‘by region’ view, the map shows ringing (when and where an individual was first ringed) and recovery locations, coloured according to different European regions of origin denoting where an individual was originally ringed. Users can toggle data layers according to geographic region using the right-hand menu.
Tracking data
Tracking data is only enabled on the 'by region' view of the overall connectivity map. If tracking data is available for a species, then a tickbox will be available to 'Show tracking layer' in the right-hand menu underneath the geographic region layers. Tracking data is only available if 1) the data are stored in Movebank; and 2) the study has provided explicit permission to the Migration Atlas to use the data. We welcome the addition of new tracking studies - please contact us to learn how you can share your tracking data with the Atlas.
As GLS logger (geolocator) data include high locational uncertainty, a warning appears if the available tracking data include geolocator data.
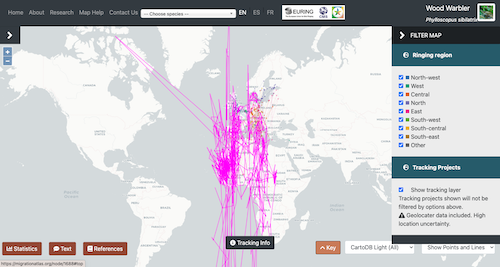
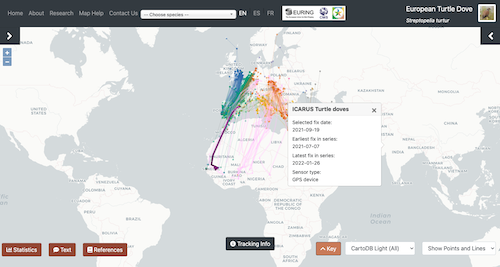
Attributions for tracking data can be viewed by clicking the 'Tracking info' button once the tracking layer is enabled. Tracks belonging to individual animals can be highlighted by clicking on or near a track.
By age
The ‘by age’ view shows connectivity patterns according to different age individuals, where the age of an individual is derived relative to its recorded age when initially ringed and using its most commonly documented age at first breeding. The age of an individual was categorised as: unknown – no information at all on age; unknown, full-grown & flying, but otherwise unknown; first year – until, but not including, the time until the start of the first breeding season (taken as 1 Jun) following the year in which it was hatched, encompassing the first autumn and spring migration; immature – from 1 Jun of the first breeding season following hatching, until, but not including, the start of the first breeding season (1 Jun) based on the documented age at first breeding;after first year – could be immature or adult; adult – anytime after the start of the first breeding season (1 Jun) based on documented age at first breeding. Age at first breeding was taken either from Wernham et al. 20021 or Birds of the World2.
By sex
The ‘by sex’ view shows connectivity patterns according to different sexes (male, female), where it is possible to sex an individual (otherwise, unknown).
Connectivity by condition
This map shows the connectivity patterns and distribution of recoveries according to major encounter categories with respect to individuals recovered either dead or alive in different circumstances (dead & shot for any reason, e.g. hunting, crop protection, for skin; dead & intentionally taken for any reason, e.g. for crop protection, nature conservation, scientific investigation; dead for any other reason and sick / injured, e.g. natural causes, disease, predation, weather, power lines; alive & a ringing recovery; alive & identifiable by other means, e.g. colour marks, tracking device, metal ring read in the field; alive, other but no additional information provided).
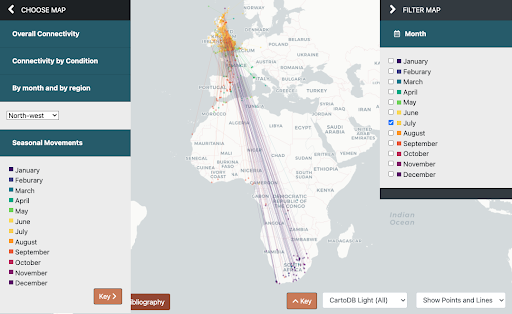
Connectivity by month
This map shows connectivity patterns in different geographic regions according to the months of the year. Because of the broad geographic scope of the Migration Atlas, it is impossible to define bespoke breeding, migration and non-breeding seasons for every species throughout all of the different European regions. Users are therefore able to define their own bespoke ‘seasons’ by filtering map layers according to specific months. Users are first required to select a geographic region. The selected month layers then show all encounters within the selected region and filtered month(s) (independent of whether they are a ringing or recovery encounter), with the corresponding line and the ‘destination’ or ‘end’ point of the line coloured according to the month in which that end point occurs, as shown below.
Seasonal movements
This animated map shows seasonal occurrence patterns of encounters (independent of whether they are a ringing or recovery encounter), in either 10-day or monthly time steps, depending on the number of records available for a species, coloured according to ringing region.
Statistics
Mapped data have been optimised to show only distant (>= 50 km) recoveries and a maximum of 10,000 recoveries for data-rich species; however, the Statistics, apart from the histogram of distances moved, includes all available valid data.
Summary of records
This table provides information on the number of total records, individuals and recoveries per species in the database, relative to the number of mapped records.
Pie chart of recovery categories
These graphs show the proportion of different recovery types for all recoveries in an entire species’ dataset, and for different time segments (pre-1961, 1961-1990, and 1991 to present), either for all geographic regions together or by separate regions.
Histogram showing distance moved by region
This graph shows the distribution of distances (orthodrome i.e. great circle distance) moved between ringing and subsequent encounters, filterable by geographic region. Local (< 50 km) recoveries are not mapped by the Migration Atlas.
Number of encounters by region
This graph shows the number of encounters according to the different geographic regions of Europe.
Number of encounters by 10 day period or month
This graph shows the number of encounters per 10 day period or month, depending on the number of total valid records available for a species.
Number of encounters by 10 day period or month by sex
This graph shows the number of encounters per 10 day period or month, depending on the number of total valid records available for a species, with bars showing patterns for the different sex categories.
Number of encounters by 10 day period or month by age
This graph shows the number of encounters per 10 day period or month, depending on the number of total valid records available for a species, with bars showing patterns for the different age categories.
Number of encounters by year
This graph shows the number of encounters per year.
Sensitive species
The geographical accuracy of locations of certain sensitive species may be downgraded by some ringing schemes, for example for certain raptors, owls, or other rare breeding species. In some cases, this may produce a grid-like pattern of points, where the specificity of locations has been reduced to the nearest central location (e.g. the centroid of the 100 km grid square within which the true location occurs). This downgrading may only apply to certain countries where a ringing scheme wished to obscure the locations of sensitive species, so not all data for that species is necessarily affected.
Species list and taxonomic splits
The Migration Atlas uses the HBW-BirdLife species taxonomy. For some species, this taxonomy recognises species splits which are not always identifiable species in the ringing data, especially for historic data when a now-distinct species had not yet been recognised. In these cases, ‘split’ species are grouped under their ‘parent’ species complex. For example, Yellow-legged (Larus michahellis) and Caspian Gull (L. cachinnans) data falls under that of European Herring Gull (L. argentatus); Manx Shearwater (Puffinus puffinus) comprises data for Manx, Yelkouan (P. yelkouan) and Balearic (P. mauretanicus) Shearwaters; Subalpine Warbler (Curruca cantillans) includes data for Moltoni’s warbler (C. subalpina), Western Subalpine Warbler (C. iberiae), and Eastern Subalpine Warbler (C. cantillans); etc.
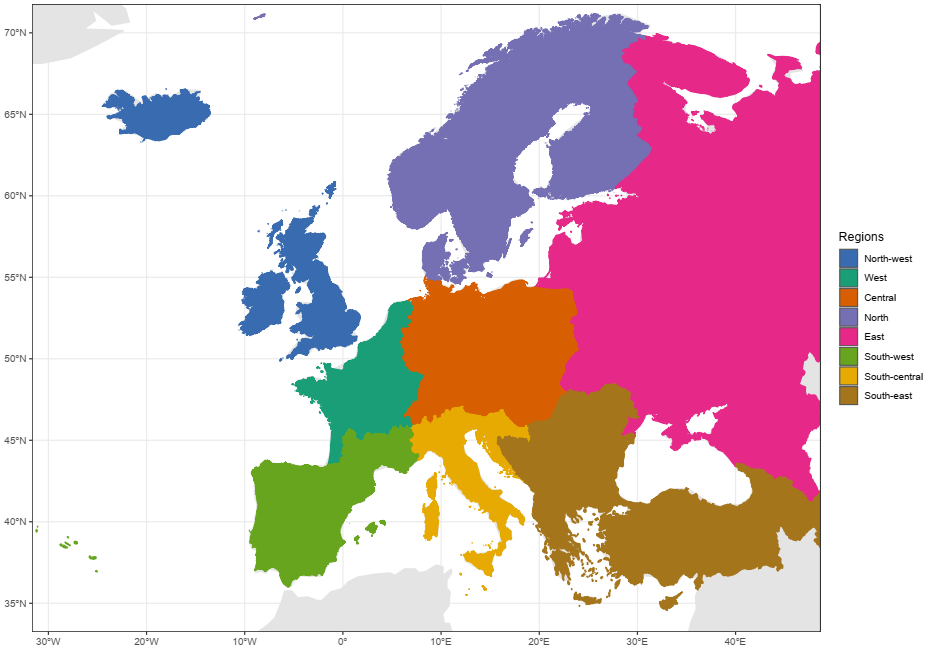
Geographic regions of Europe
Countries are grouped into the geographic regions shown below. Regional groupings generally fall along geopolitical boundaries, apart from 28 EURING regions in southern France which are grouped into the South-west region with Iberia; and Corsica which is grouped in the South-central region. On the overall connectivity map, ringing and recovery encounters originating from these geographic regions are coloured according to the palette shown below. Any recoveries of individuals ringed outside of these regions are categorised as ‘Other’, coloured in dark grey.
Biases & interpretation
Spatial biases
Connectivity patterns are based primarily on ringing data, and on tracking data if any are available for the species. Potential biases in ringing data may arise from spatial patterns in both ringing and recovery effort. Most fundamentally, ringing data are primarily biased by the level of effort in numbers of birds ringed, which can vary substantially by species and country. As an example, ringing data may be spatially biased towards particular ringing stations, colonies, countries, or stopover sites. For some species, certain localised studies may contribute a large proportion of available ringing data. Ringing and recovery effort is much lower in non-breeding areas outside of Europe, with very little coverage for species which overwinter in e.g. equatorial Africa. Species which are hunted in Europe and elsewhere may exhibit spatial biases in recovery patterns based on the prevalence with which the species is targeted for hunting in different countries.
Temporal biases
Temporal biases in ringing data primarily arise due to variation in ringing and recovery effort over time, and variation in the main sources of recoveries. Effort varies both seasonally and annually depending on species. For example, many species are mainly ringed during the season when they are most easily targeted e.g. seabirds, gulls and herons at breeding colonies (chicks and/or adults) - however, this may vary from country to country. Broadly, ringing effort for many species has increased since the mid-20th century, although annual variation in effort may arise according to particular studies which ring large numbers of individuals starting and stopping.
Annual variation in the main sources of recoveries can be attributed primarily to a decrease in or ban on hunting by many European countries from the late-20th century onwards, and the rise of colour-marking, where individuals can be identified at a distance by unique combinations of coloured and/or alphanumeric coded rings or similar marks. These temporal biases are inevitably associated with spatial biases as well. For example, variation in the timing of hunting bans by different countries may produce both spatially and temporaily biased connectivity and recovery patterns for particular species. Similarly, variable increases in colour-marking of particular species have occurred in different countries over the last few decades.
Tracking data biases
Tracking data are firstly biased by species, as the size of the species restricts which devices can be safely used from an animal welfare perspective (Bridge et al. 20113). In general, tracking data will be biased towards larger-bodied species, particularly so for high-resolution data from larger devices such as GPS devices and satellite transmitters, whereas GLS loggers (also called light-level geolocators) may be used across a range of different body sizes. As for ringing data, tracking data may be spatially biased towards certain study locations or populations of a species where tracking devices have been deployed. However, once devices are deployed, tracking data are relatively unbiased, allowing researchers to monitor movements in a relatively ‘hands off’ manner, unlike ringing data which require a recovery (with associated spatial biases) to derive a movement pattern.
Tracking data vary in their level of locational precision, with GPS devices (similar to what is in most mobile phones) generally being the most precise, followed by satellite transmitters, and then finally GLS loggers. Uncertainty in the locations provided by the latter devices can be substantially greater than for the two former devices due to how they determine a global location. GLS loggers derive a global location from calculations based on recorded light levels, which can then be used to derive sunrise and sunset times relative to an internal clock. As a result, locations from GLS devices can be subject to high uncertainty in certain situations, particularly around the spring and autumn equinox with equal day lengths at every location on Earth; in 24-hour day length environments close to the poles; and in highly shaded environments, for example, dense forest-dwelling species or species where the device is shaded during incubation (e.g. in a box-, hole- or crevice-nesting species, or if the device is attached to the leg).
Data validation and filtering
Data validation
There are over 24 million ringing encounter records (where encounter = either a ringing or recovery event) in the EURING Databank (EDB). Data presented include records submitted up to January 2020. Not all EURING schemes submit ringing-only records of an individual, and so the data presented in the Atlas visualisations and statistics comprise only those individuals which have one or more recoveries in addition to the ringing event. The first data validation step was a geographic check to match the geographic coordinates of a record against its four digit place code indicating the country and region. The database was then searched for duplicate records where the same ring is recorded more than once by different ringing schemes. Records were then processed through a series of checks on a scheme-by-scheme basis. Validation checks looked for invalid codes in each field according to the EURING Exchange Code 2020 manual (v201). Logic checks generally examined the encounter history of individual rings and looked for cases where:
- Only a single encounter of a ring was present in the database;
- The ringing event was missing;
- More than one encounter of a ring was recorded as the ringing event;
- The species code as recorded by the ringing scheme changed between encounters;
- The ringing event was not recorded as chronologically first in the encounter history;
- An individual was recorded as alive after it was recorded dead;
- An individual was recorded as a chick in more than one year;
- An individual was recorded as dead on more than one encounter.
Data filtering
Data were subsequently filtered for inclusion in the Atlas. Records were excluded if:
- Coordinate accuracy could not be specified to a radius of less than 500 km;
- Coordinates did not match a given place code to within 50 km of either the region or the country specified by the place code; or, the geographic check matching coordinates to place codes did not return any information;
- Any invalid EURING codes in the fields: date, geographical coordinates, metal ring information,
- It was a same-day recapture of the same bird;
- It was the only encounter of that ring present in the database.
Entire encounter histories of an individual ring were excluded if:
- The ringing event was missing;
- More than one encounter of a ring was recorded as the ringing event;
- The species code as recorded by the ringing scheme changed between encounters;
- The ringing event was not recorded as chronologically first in the encounter history;
- An individual was recorded as alive after it was recorded dead;
- An individual was recorded as a chick in more than one year.
Optimisation for mapping
To optimise the performance of the Migration Atlas and reduce the number of records per species to a number suitable for reasonable page-loading speed, not all data included in the Atlas are mapped, though all are included in the Statistics visualisations for each species.
Mapping of distant recoveries
Given the Atlas is primarily a tool for displaying migratory movements, mapped data were filtered to include only recoveries where an individual moved at least 50 km between the location where it was ringed and any locations where it was subsequently encountered.
Data-rich individuals and species
Certain species were particularly data-rich and required randomised sampling to further reduce the number of records displayed. Randomised sampling was conducted at two levels:
- Individuals - For certain species, especially those where colour-marking is prevalent, individuals may have data-rich encounter histories if they have been resighted many times. Furthermore, many of these resighting encounters may be from the same or nearby locations week after week within a season, which contribute little additional information on overall migratory movements. We randomly selected one encounter per month for an individual with clusters of three or more locations within 50 km of one another. Despite this subsampling approach, some individuals with very rich encounter histories are still apparent on maps as heavily demarcated lines between locations.
- Species - To further reduce the number of records for data-rich species, species with > 10,000 recoveries were subject to further randomised sampling. Sampling reduced the dataset by removing an individual’s entire encounter history at random, weighted proportionally towards those European regions which contribute the most records to the dataset. The default map view loads 10,000 recoveries (density filter = 0), with users able to load additional records in 10% increments using the density filter, to a maximum of +100%.
References
- Wernham, C.V., Toms, M.P., Marchant, J.H., Clark, J.A., Siriwardena, G.M. & Baillie, S.R. (eds). 2002. The Migration Atlas: movements of the birds of Britain and Ireland. T. & A.D. Poyser, London.
- Birds of the World (S. M. Billerman, B. K. Keeney, P. G. Rodewald, and T. S. Schulenberg, Editors). Cornell Laboratory of Ornithology, Ithaca, NY, USA.
- Eli S. Bridge, Kasper Thorup, Melissa S. Bowlin, Phillip B. Chilson, Robert H. Diehl, René W. Fléron, Phillip Hartl, Roland Kays, Jeffrey F. Kelly, W. Douglas Robinson, Martin Wikelski, Technology on the Move: Recent and Forthcoming Innovations for Tracking Migratory Birds, BioScience, Volume 61, Issue 9, September 2011, Pages 689–698